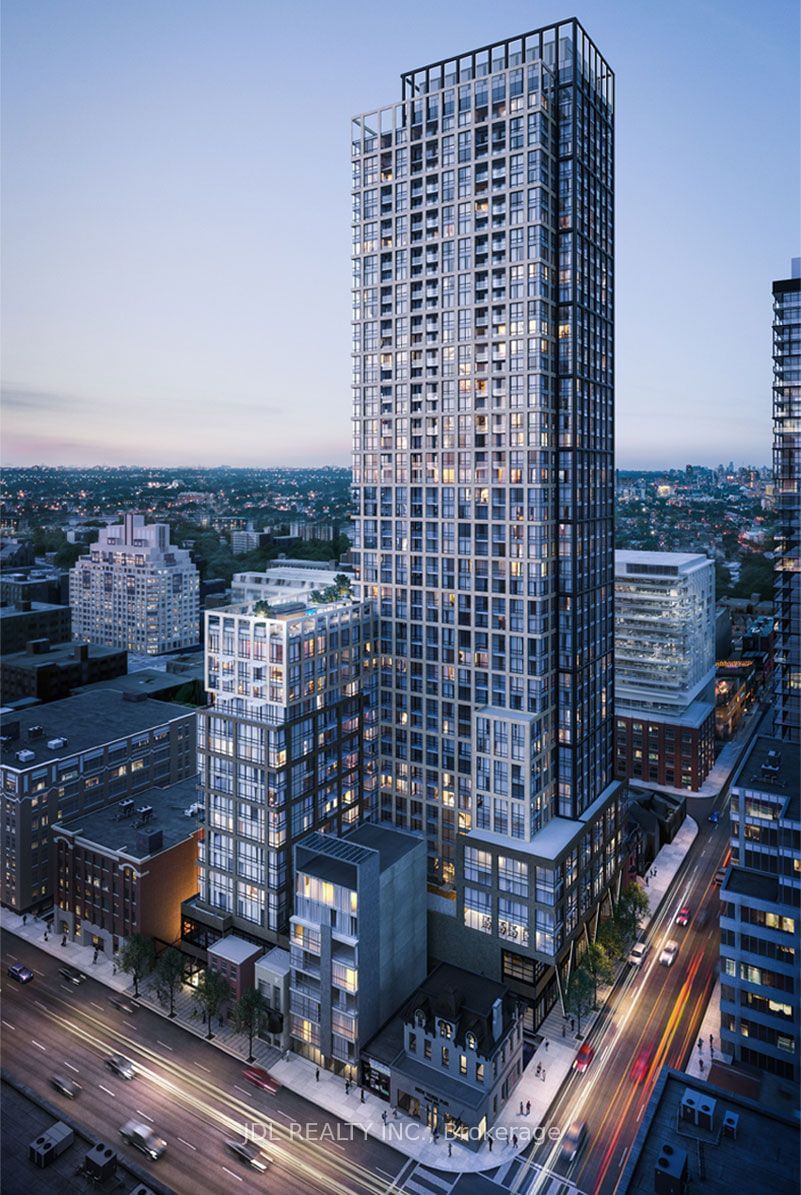
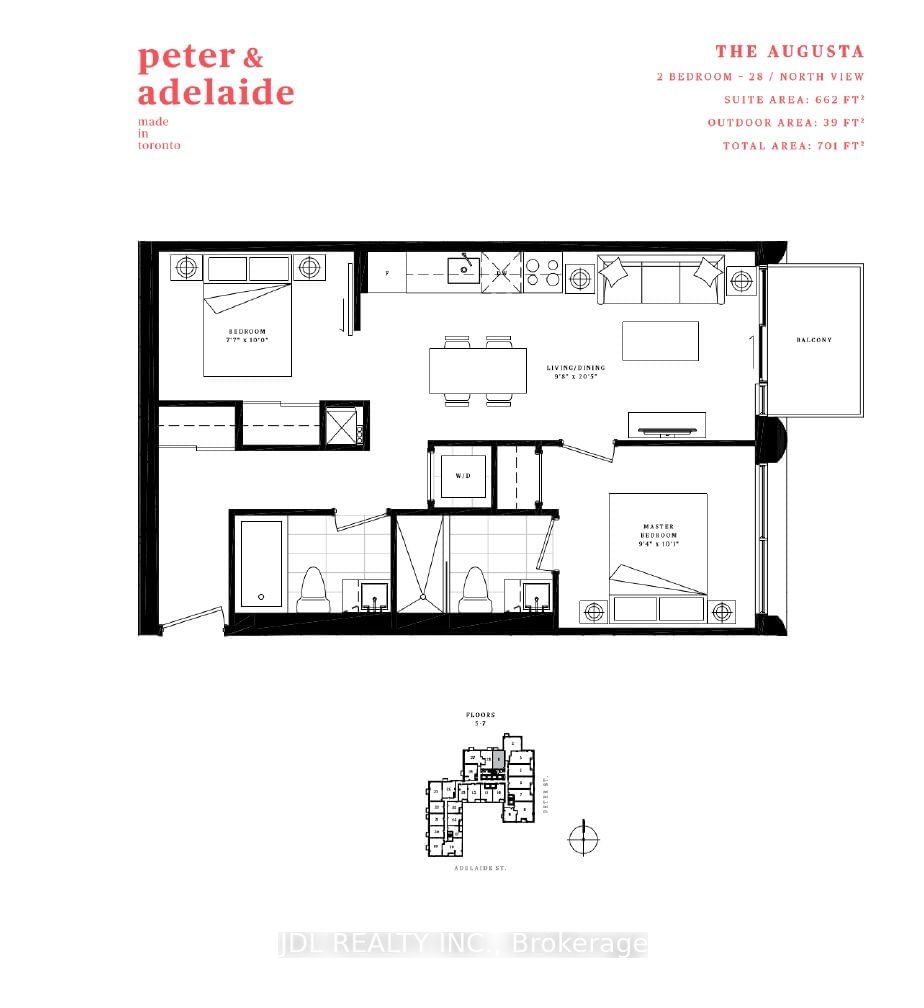
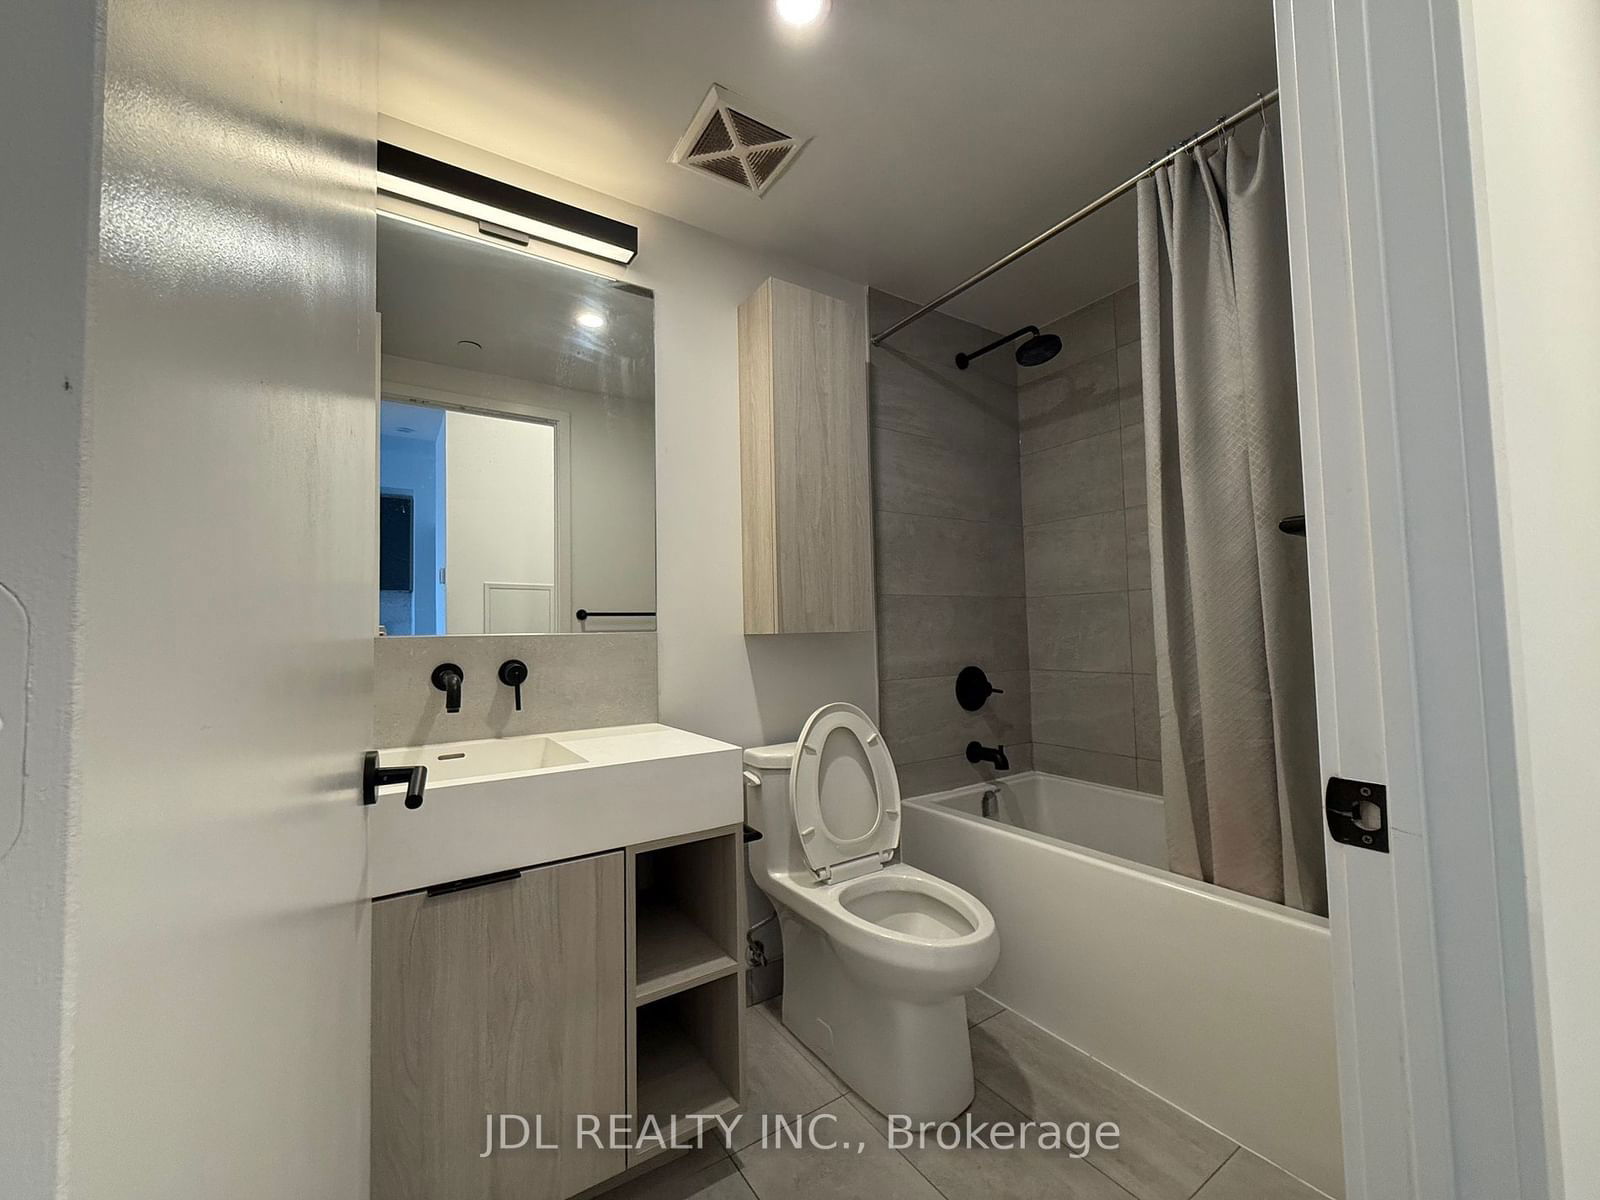
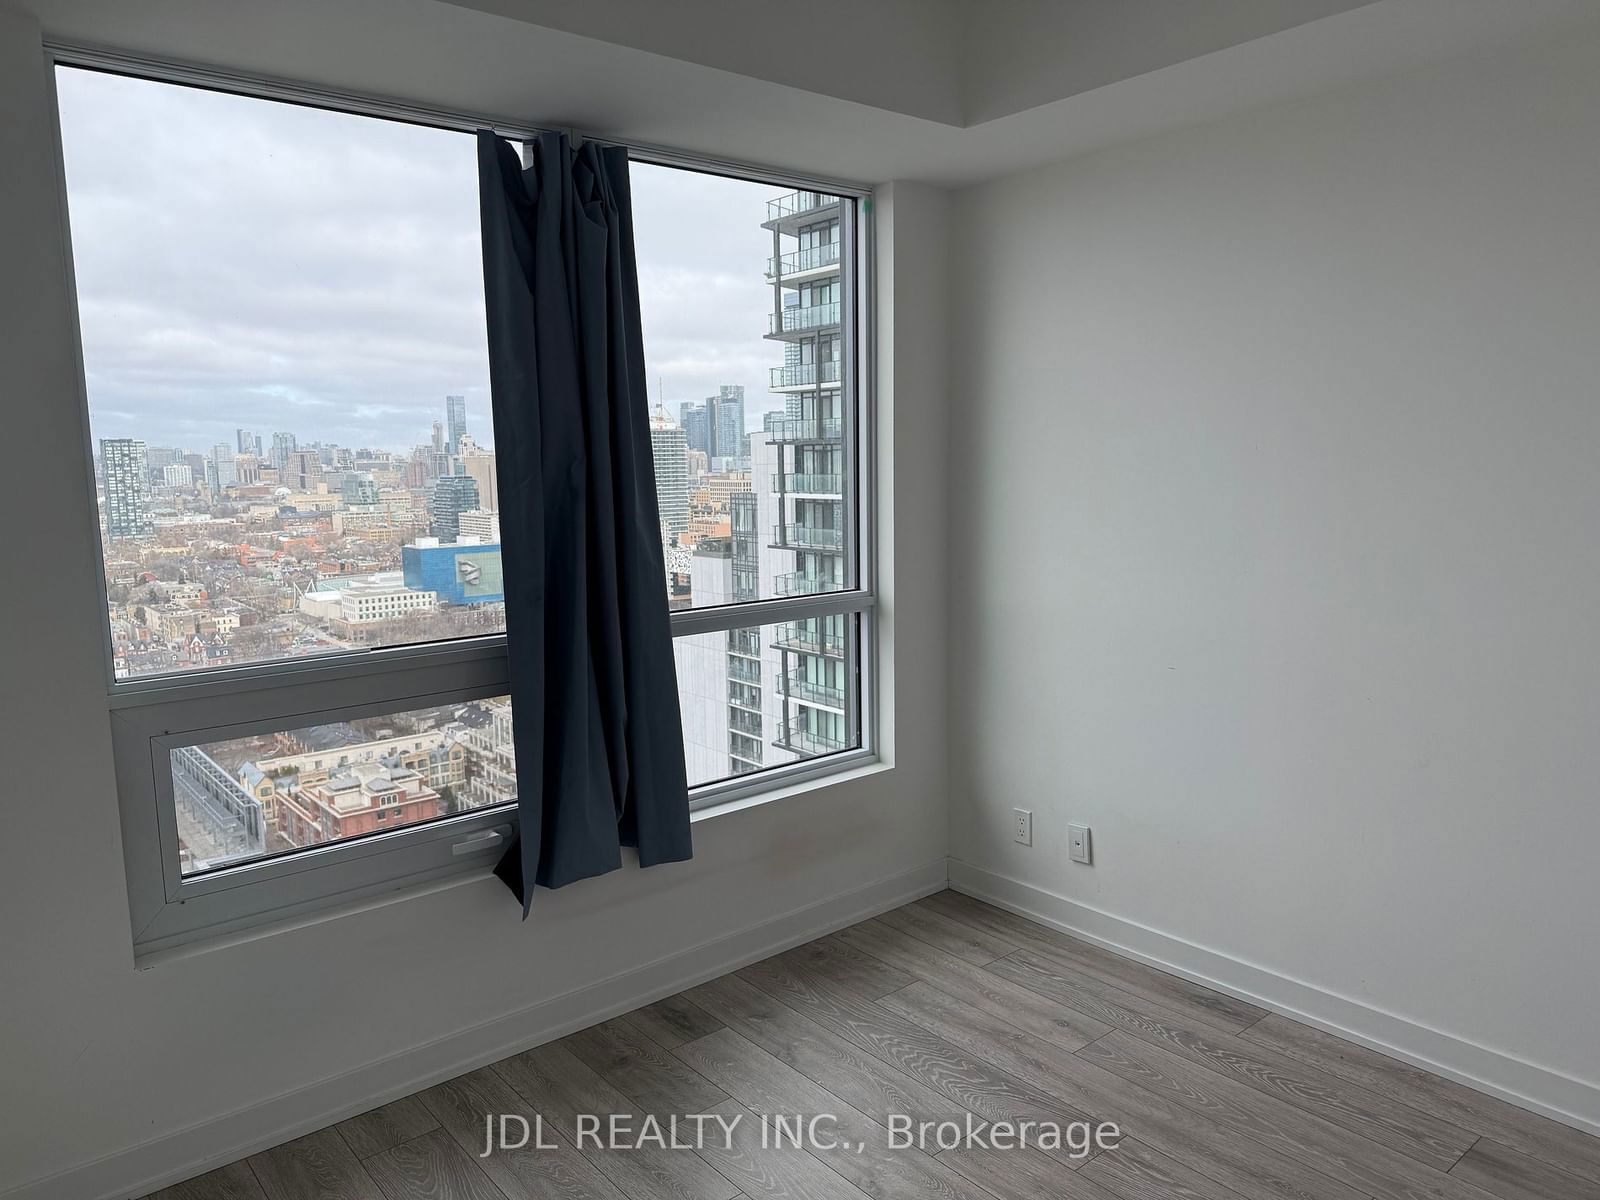
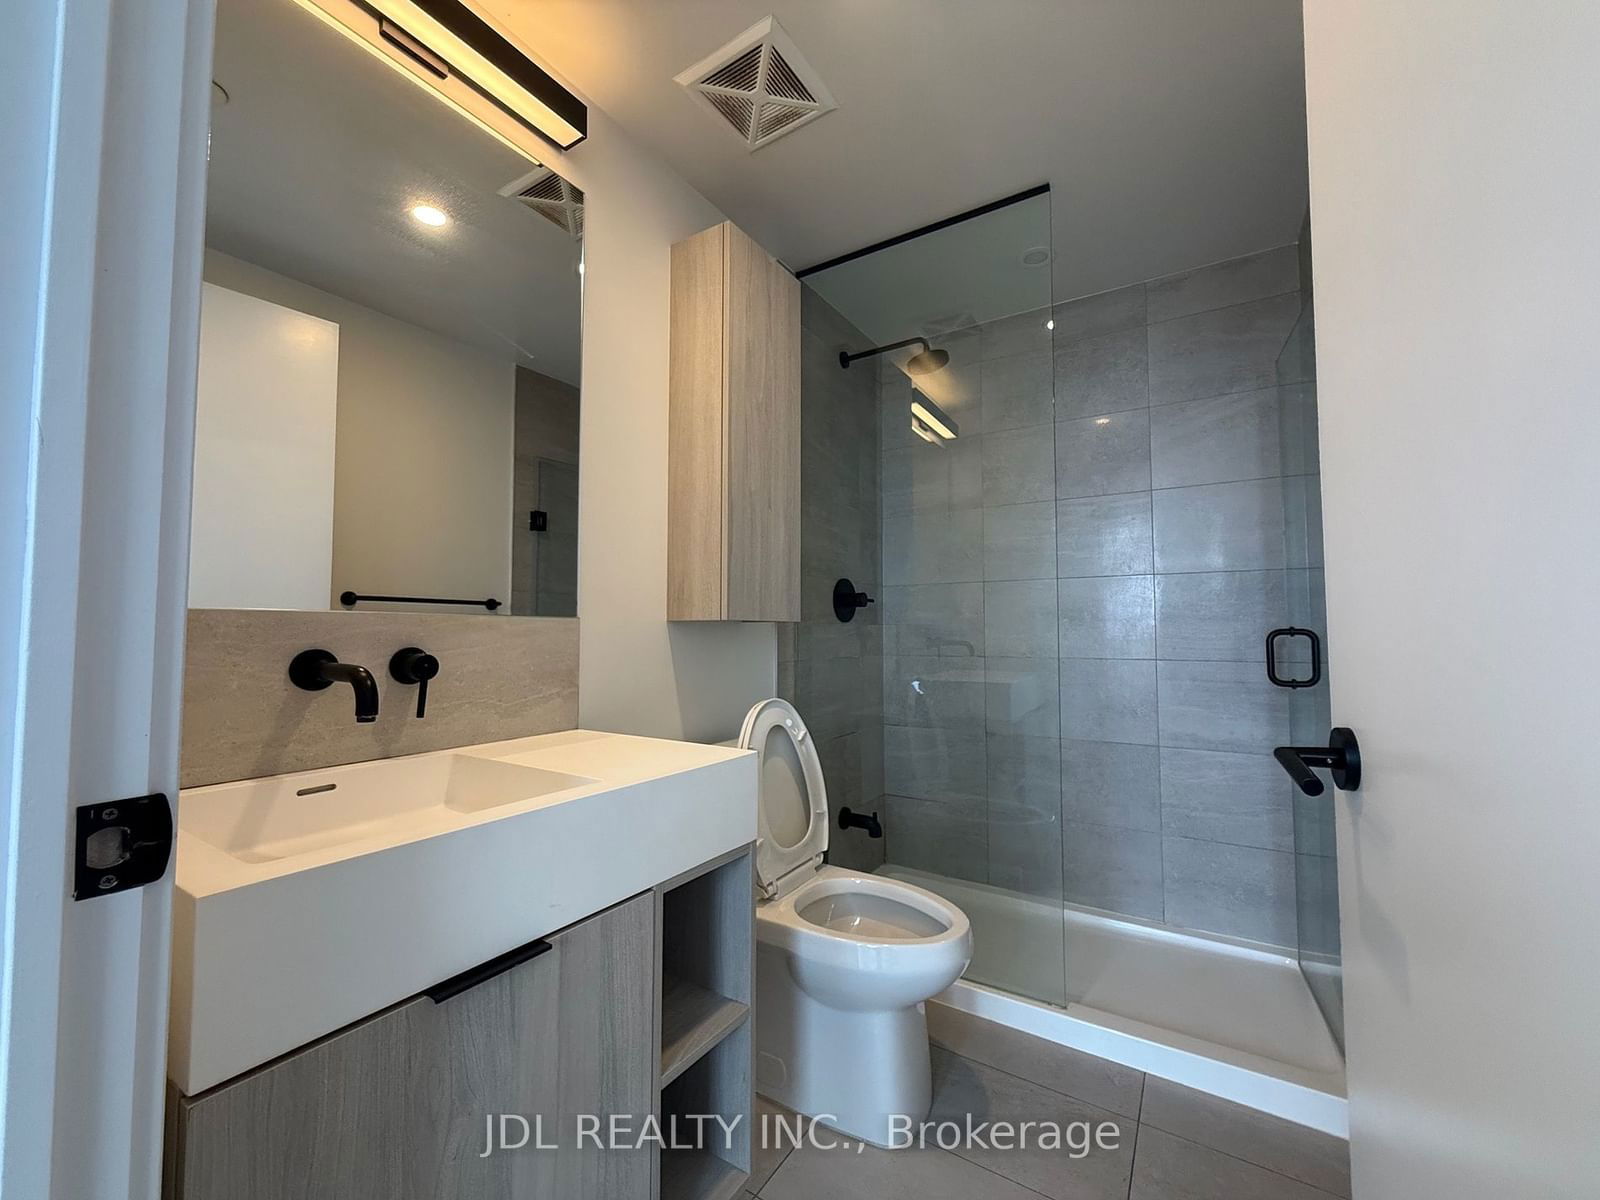
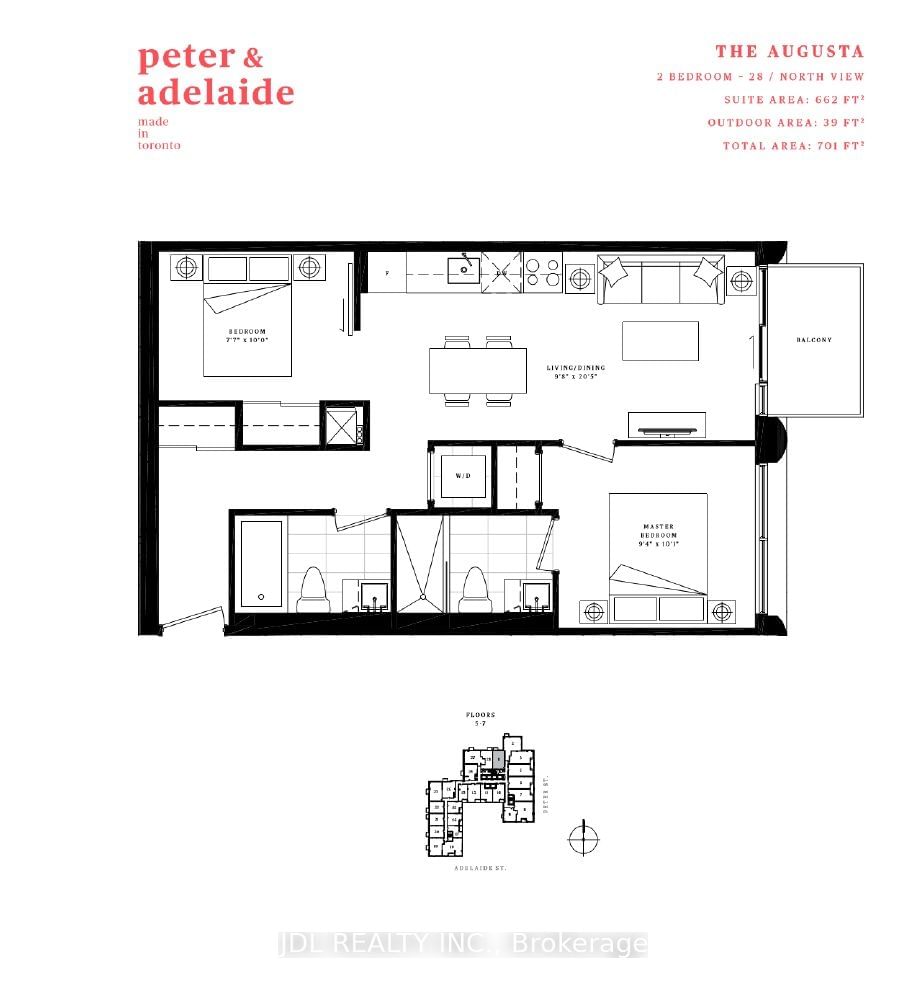
3201 - 108 PETER St
Listing History
Unit Highlights
Utilities Included
Utility Type
- Air Conditioning
- Central Air
- Heat Source
- Gas
- Heating
- Forced Air
Room Dimensions
About this Listing
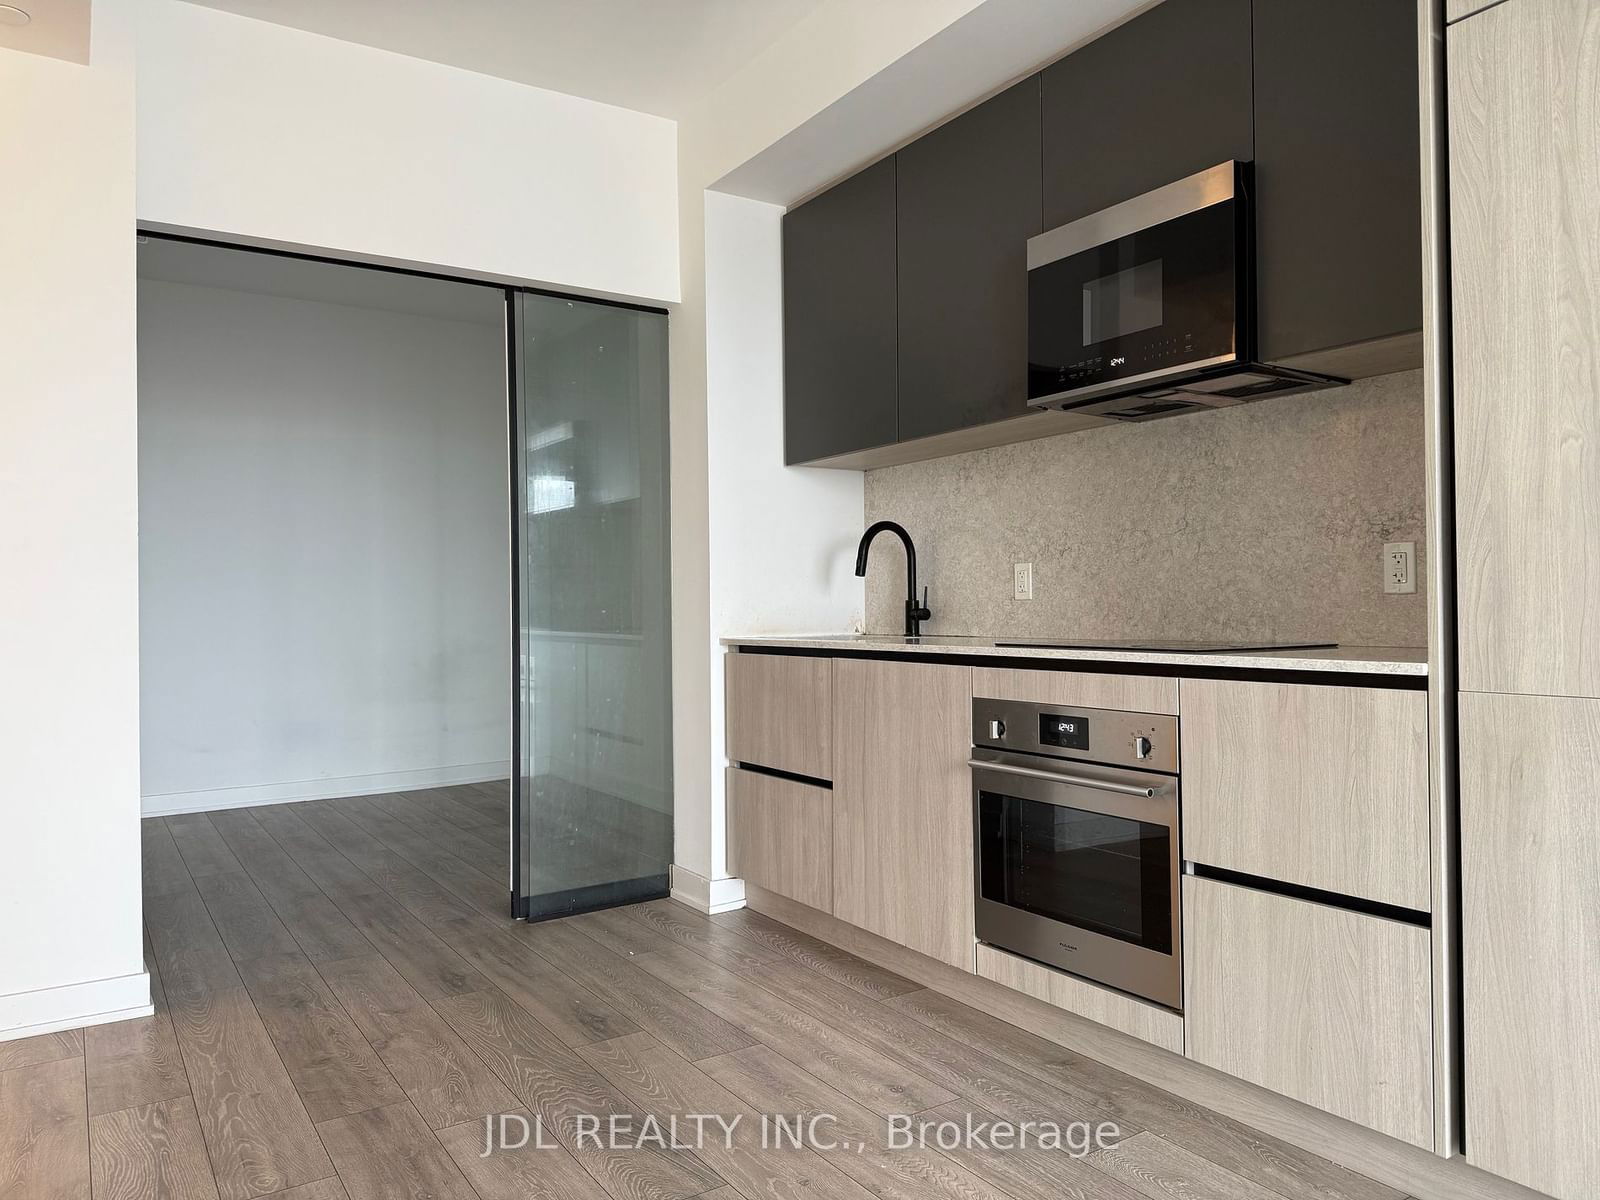
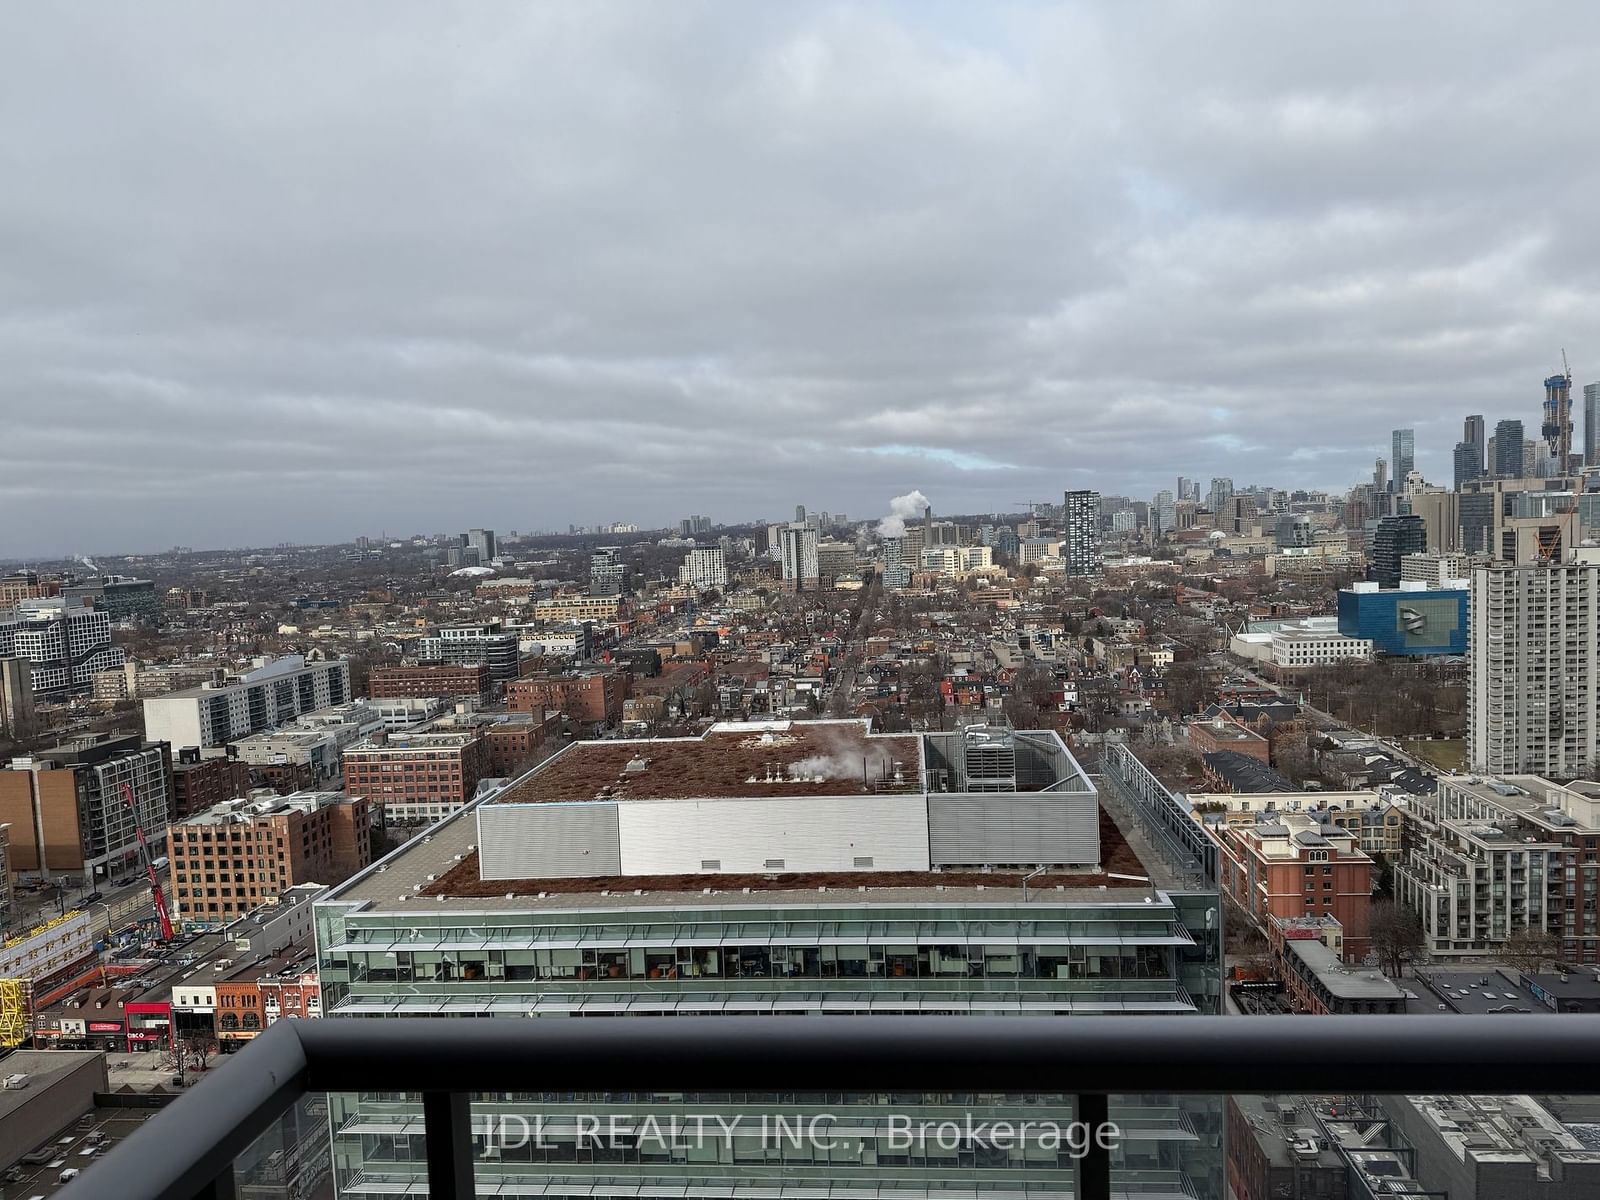
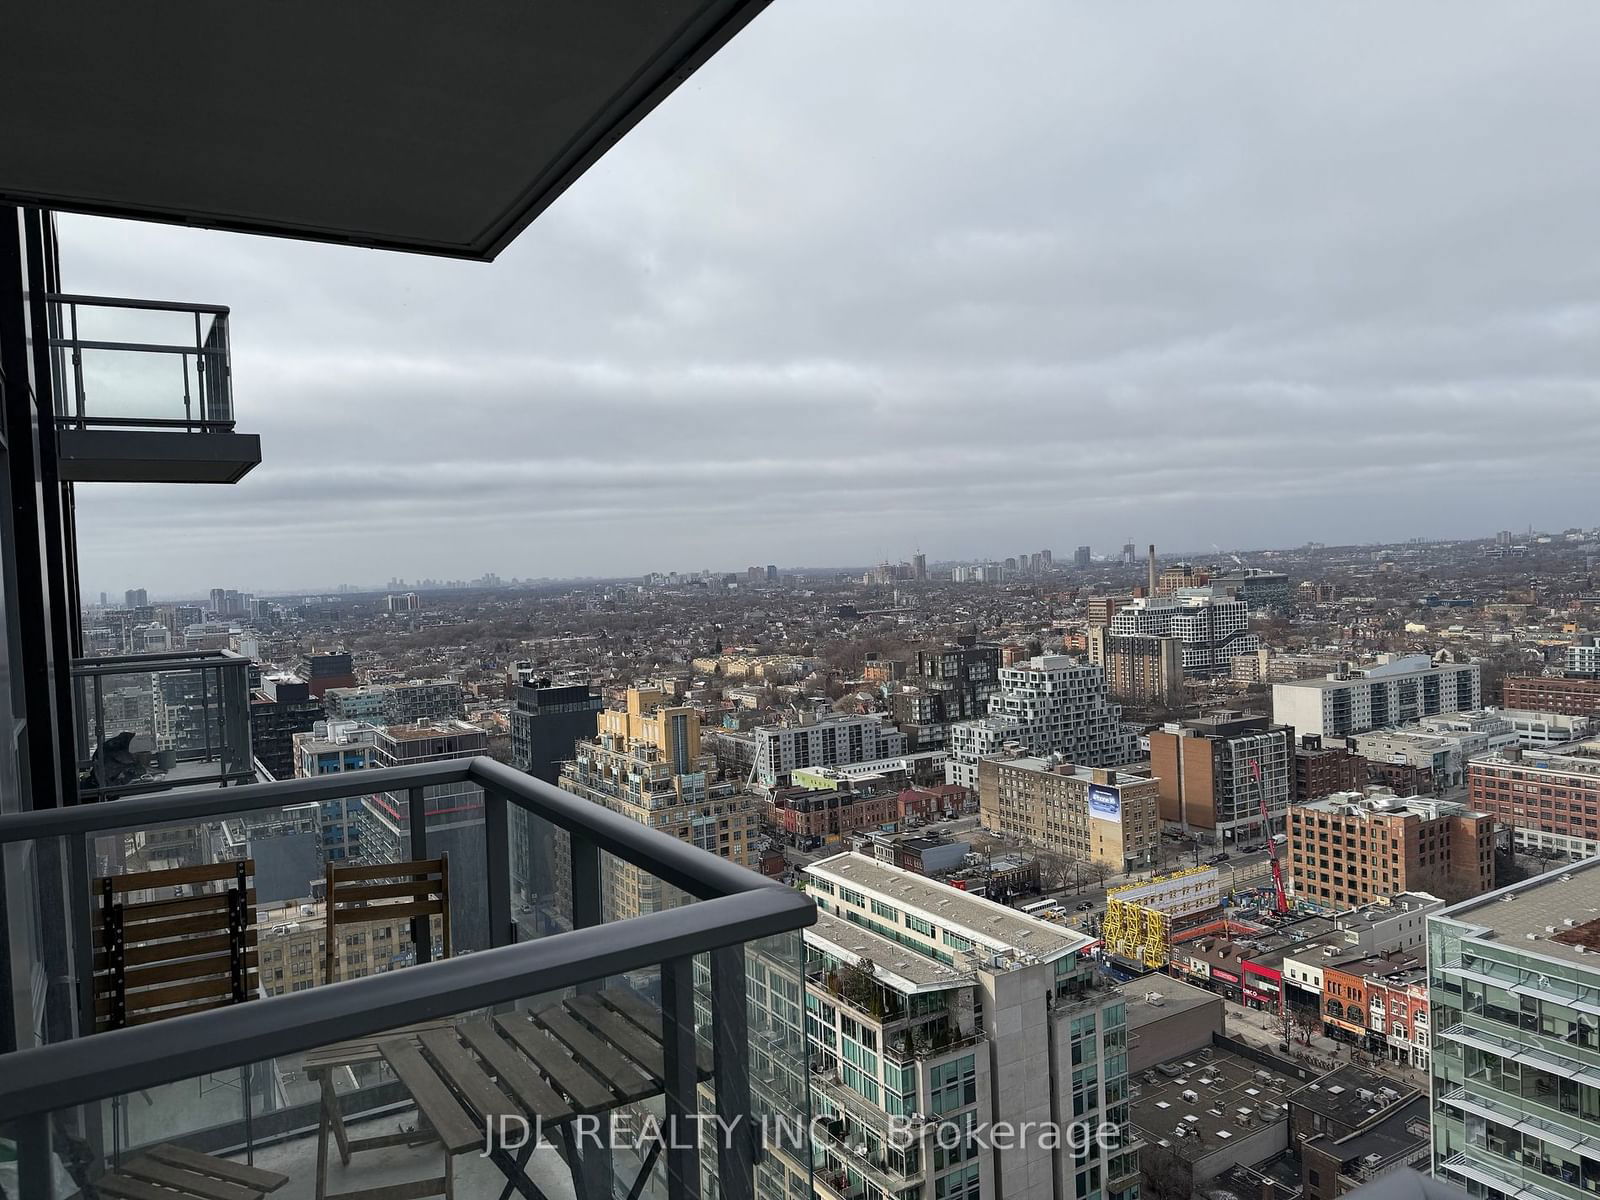
The unit has a great view. Welcome to PETER and ADELAIDE, Situated in a highly sought-after neighborhood, PETER and ADELAIDE offers a wealth of amenities inside and out. Close to PATH, Financial/Entertainment Districts, Subway and Transit Access, and a whole lot more to explore and discover in the area. Come check out these freshly finished units and make it your next home. Co-working & Rec Room, Outdoor Pool, Fitness & Yoga Studio, Infra-Red Sauna & Treatment Rooms, Demo Kitchen, Private Dining Room, Party Lounge, Terrace, Outdoor Communal Dining and Kids Zone & Arts and crafts. Book your viewing today!
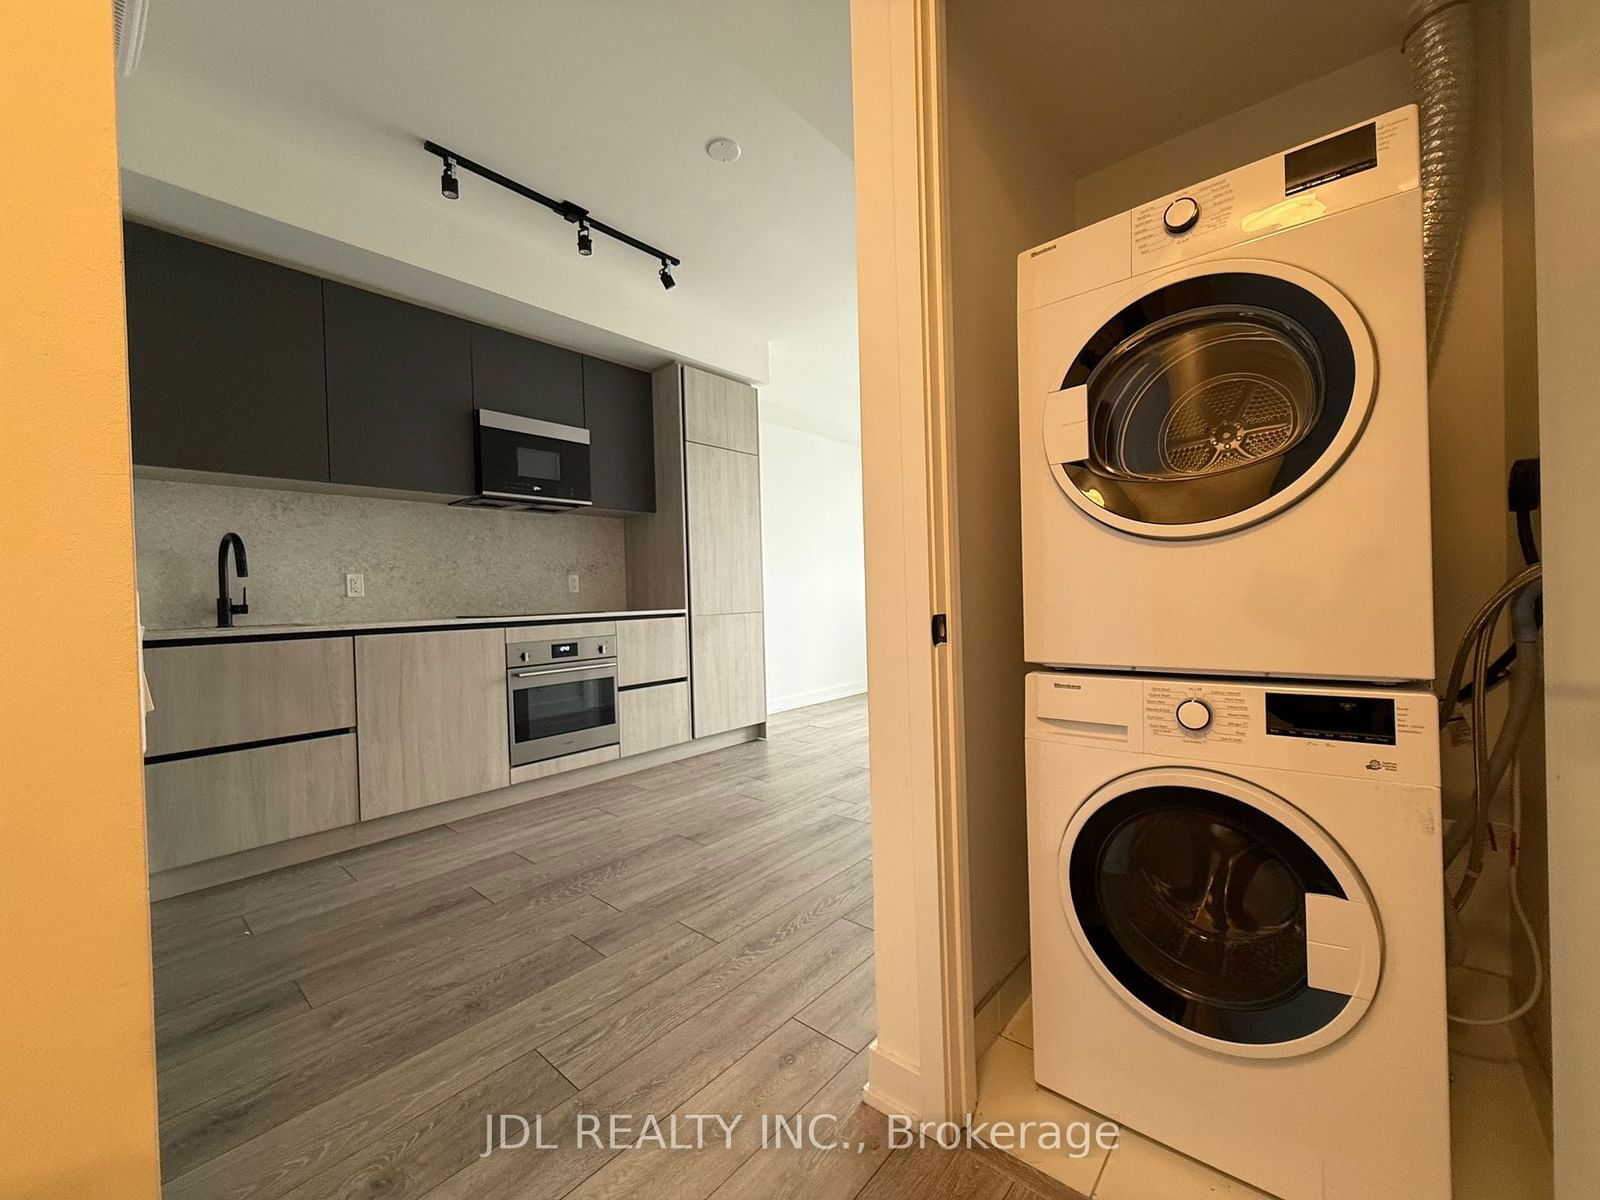
ExtrasFridge, Stove, Dishwasher, Built-In Microwave, Ensuite Washer and Dryer, Windows coverings.
jdl realty inc.MLS® #C10431440
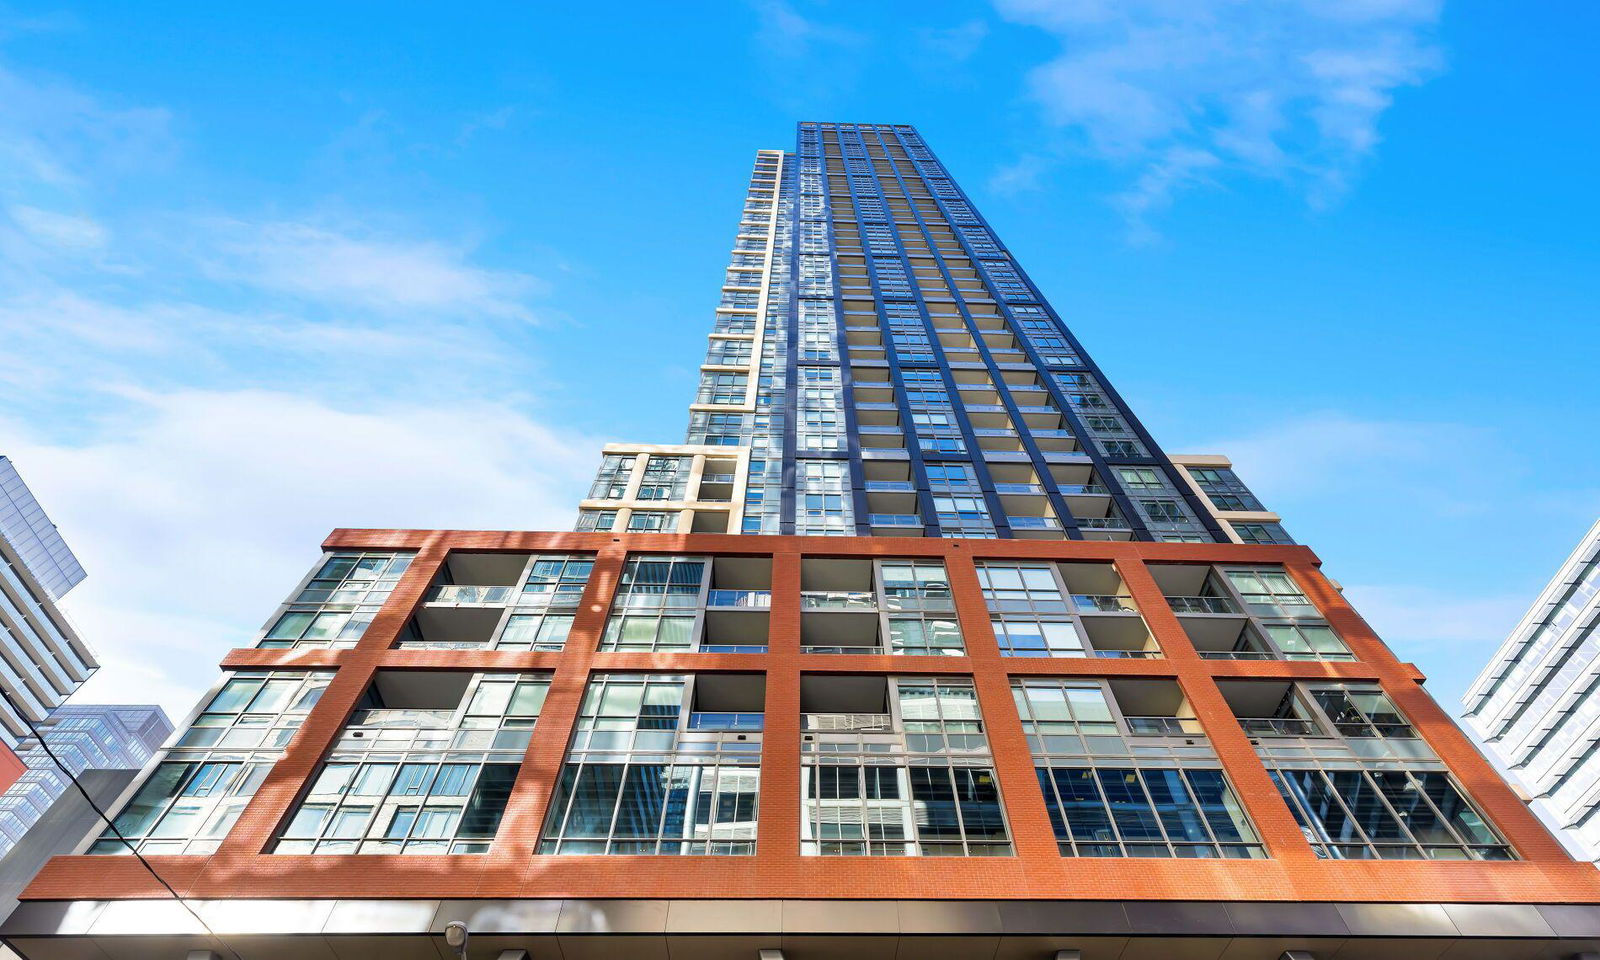
Building Spotlight
Amenities
Explore Neighbourhood
Similar Listings
Demographics
Based on the dissemination area as defined by Statistics Canada. A dissemination area contains, on average, approximately 200 – 400 households.
Price Trends
Maintenance Fees
Building Trends At Peter & Adelaide Condos
Days on Strata
List vs Selling Price
Offer Competition
Turnover of Units
Property Value
Price Ranking
Sold Units
Rented Units
Best Value Rank
Appreciation Rank
Rental Yield
High Demand
Transaction Insights at 350 Adelaide Street W
| Studio | 1 Bed | 1 Bed + Den | 2 Bed | 2 Bed + Den | 3 Bed | 3 Bed + Den | |
|---|---|---|---|---|---|---|---|
| Price Range | No Data | $485,000 - $635,000 | $590,000 - $770,000 | $720,000 - $1,070,000 | $893,000 | $875,000 - $1,340,000 | No Data |
| Avg. Cost Per Sqft | No Data | $1,202 | $1,187 | $1,152 | $1,298 | $1,142 | No Data |
| Price Range | No Data | $1,350 - $2,700 | $2,250 - $3,200 | $1,380 - $3,500 | $2,950 - $3,700 | $2,800 - $5,450 | No Data |
| Avg. Wait for Unit Availability | No Data | 46 Days | 38 Days | 42 Days | No Data | 87 Days | No Data |
| Avg. Wait for Unit Availability | 22 Days | 5 Days | 3 Days | 4 Days | 11 Days | 11 Days | No Data |
| Ratio of Units in Building | 1% | 21% | 32% | 31% | 7% | 10% | 1% |
Transactions vs Inventory
Total number of units listed and leased in Queen West
